Prometheus Grafana setup
How to set up Grafana with Temporal Cloud PromQL endpoint to view Cloud metrics.
Temporal Cloud emits metrics through a Prometheus HTTP API endpoint, which can be directly used as a Prometheus data source in Grafana or to query and export Cloud metrics to any observability platform.
For setting up SDK metrics (emitted by your Workers and Clients), see SDK metrics setup.
The process for setting up Temporal Cloud PromQL to work with Grafana includes the following steps:
- Generate a Prometheus HTTP API endpoint on Temporal Cloud using valid certificates.
- Run Grafana and set up a data source for Temporal Cloud metrics in Grafana.
- Create dashboards in Grafana to view Temporal Cloud metrics. Temporal provides sample community-driven Grafana dashboards for Cloud metrics that you can use and customize according to your requirements.
If you're following through with the examples provided here, ensure that you have the following:
-
Root CA certificates and end-entity certificates. See Certificate requirements for details.
-
Set up your connections to Temporal Cloud using an SDK of your choice and have some Workflows running on Temporal Cloud. See Connect to a Temporal Service for details.
-
Grafana installed.
Temporal Cloud metrics setup
Before you set up your Temporal Cloud metrics, ensure that you have the following:
- Account Owner or Global Admin role privileges for the Temporal Cloud account.
- CA certificate and key for the Observability integration. You will need the certificate to set up the Observability endpoint in Temporal Cloud.
The following steps describe how to set up Observability on Temporal Cloud to generate an endpoint:
- Log in to Temporal Cloud UI with an Account Owner or Global Admin role.
- Go to Settings and select Integrations.
- Select Configure Observability (if you're setting it up for the first time) or click Edit in the Observability section (if it was already configured before).
- Add your root CA certificate (.pem) and save it. Note that if an observability endpoint is already set up, you can append your root CA certificate here to use the generated observability endpoint with your instance of Grafana.
- To test your endpoint, run the following command on your host:
If you have Workflows running on a Namespace in your Temporal Cloud instance, you should see some data as a result of running this command.
curl -v --cert <path to your client-cert.pem> --key <path to your client-cert.key> "<your generated Temporal Cloud prometheus_endpoint>/api/v1/query?query=temporal_cloud_v0_state_transition_count" - Copy the HTTP API endpoint that is generated (it is shown in the UI).
This endpoint should be configured as a data source for Temporal Cloud metrics in Grafana. See Grafana data source configuration for details.
Grafana data source configuration
How to configure the Temporal Cloud metrics data source in Grafana.
Depending on how you use Grafana, you can either install and run it locally, run it as a Docker container, or log in to Grafana Cloud to set up your data sources.
If you have installed and are running Grafana locally, go to http://localhost:3000 and sign in.
To add the Temporal Cloud Prometheus HTTP API endpoint that we generated in the Temporal Cloud metrics setup section, do the following:
- Go to Configuration > Data sources.
- Select Add data source > Prometheus.
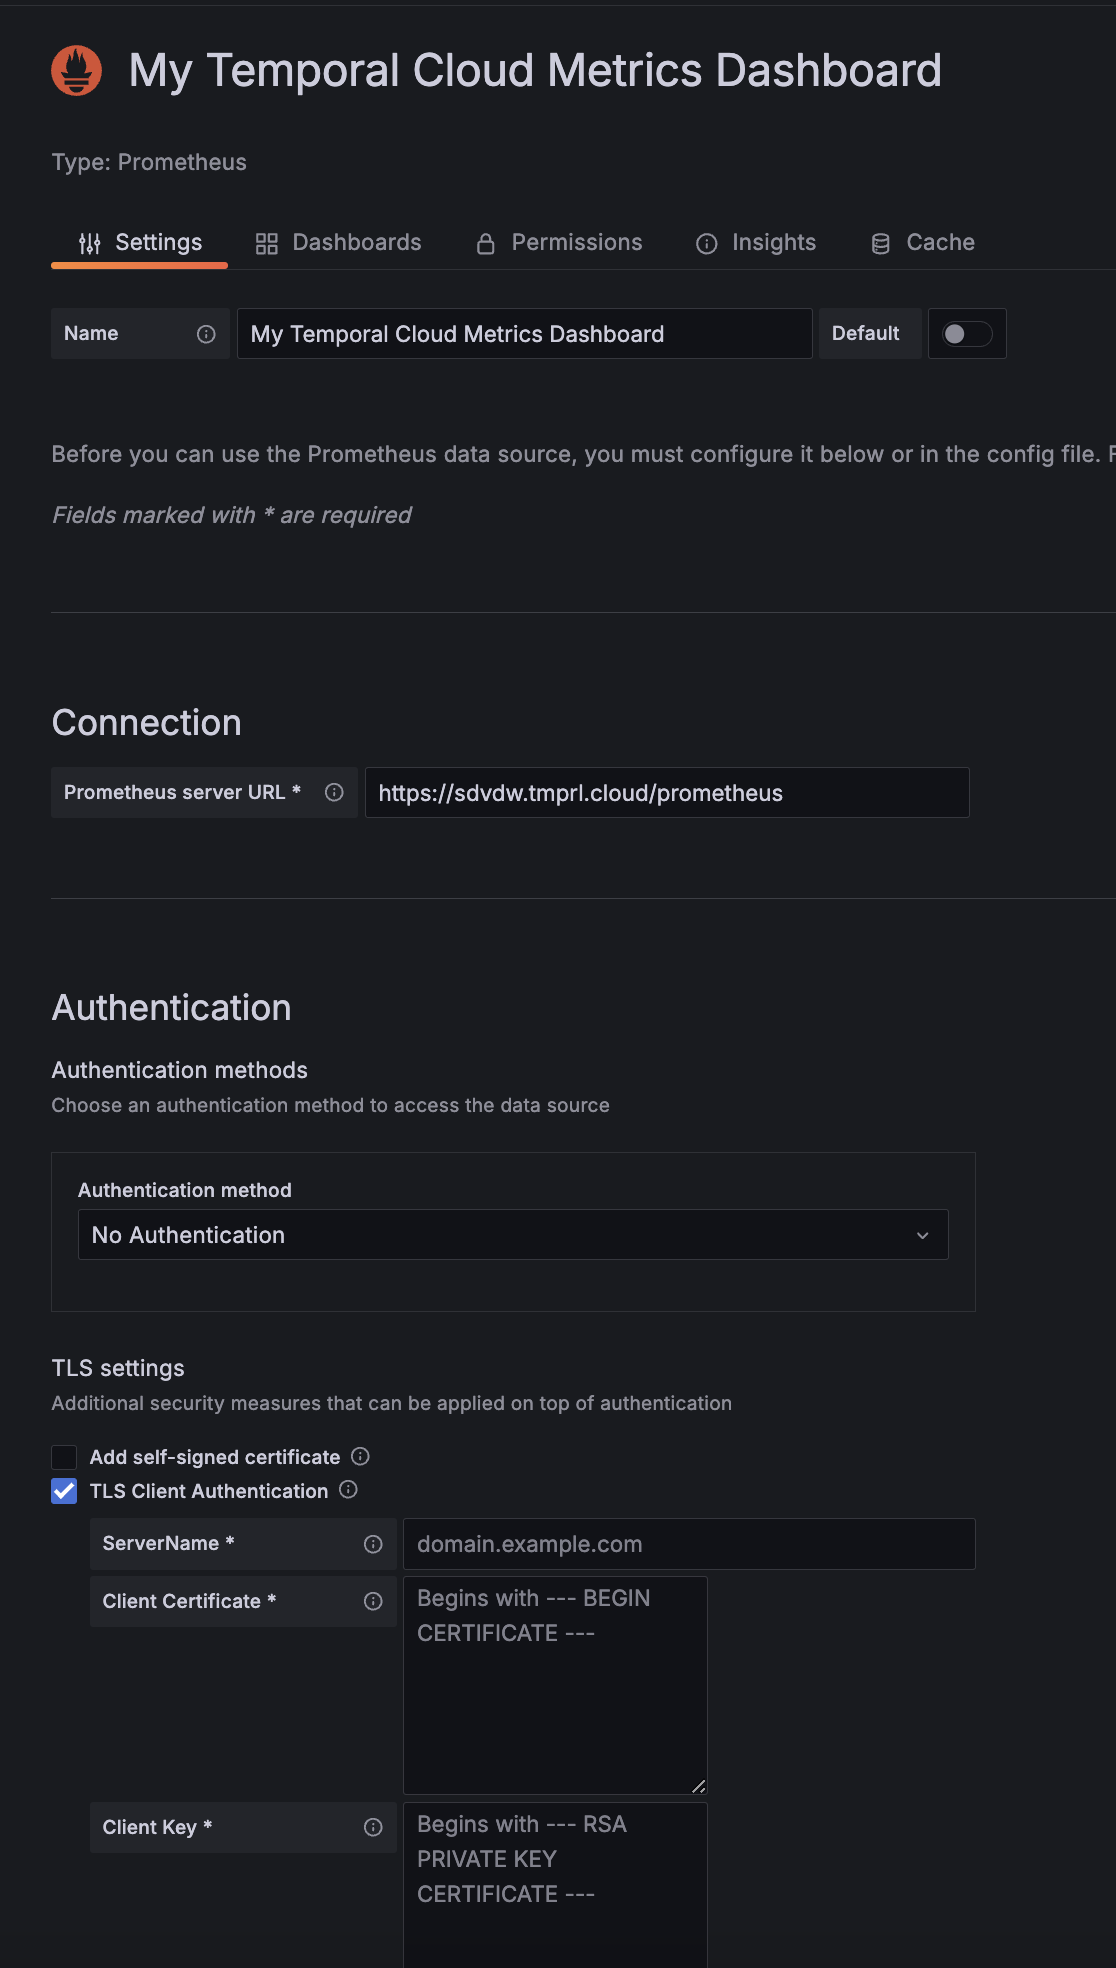
- Enter a name for your Temporal Cloud metrics data source, such as Temporal Cloud metrics.
- In the Connection section, paste the URL that was generated in the Observability section on the Temporal Cloud UI.
- The Authentication section may be left as No Authentication.
- In the TLS Settings section, select TLS Client Authentication:
- Leave ServerName blank. This is not required.
- Paste in your end-entity certificate and key.
- Note that the end-entity certificate used here must be part of the certificate chain with the root CA certificates used in your Temporal Cloud observability setup.
🔍Click image to expand
- Click Save and test to verify that the data source is working.
If you see issues in setting this data source, verify your CA certificate chain and ensure that you are setting the correct certificates in your Temporal Cloud observability setup and in the TLS authentication in Grafana.
Grafana dashboards setup
To set up dashboards in Grafana, you can use the UI or configure them directly in your Grafana deployment.
Temporal provides community-driven example dashboards for Temporal Cloud that you can customize to meet your needs.
To import a dashboard in Grafana:
- In the left-hand navigation bar, select Dashboards > Import dashboard.
- You can either copy and paste the JSON from the Temporal Cloud sample dashboards, or import the JSON files into Grafana.
- Save the dashboard and review the metrics data in the graphs.
To configure dashboards with the UI:
- Go to Create > Dashboard and add an empty panel.
- On the Panel configuration page, in the Query tab, select the "Temporal Cloud metrics" data source that you configured earlier.
- Expand the Metrics browser and select the metrics you want. You can also select associated labels and values to sort the query data. The PromQL documentation lists all metrics emitted from PromQL in Temporal Cloud.
- The graph should now display data based on your selected queries.